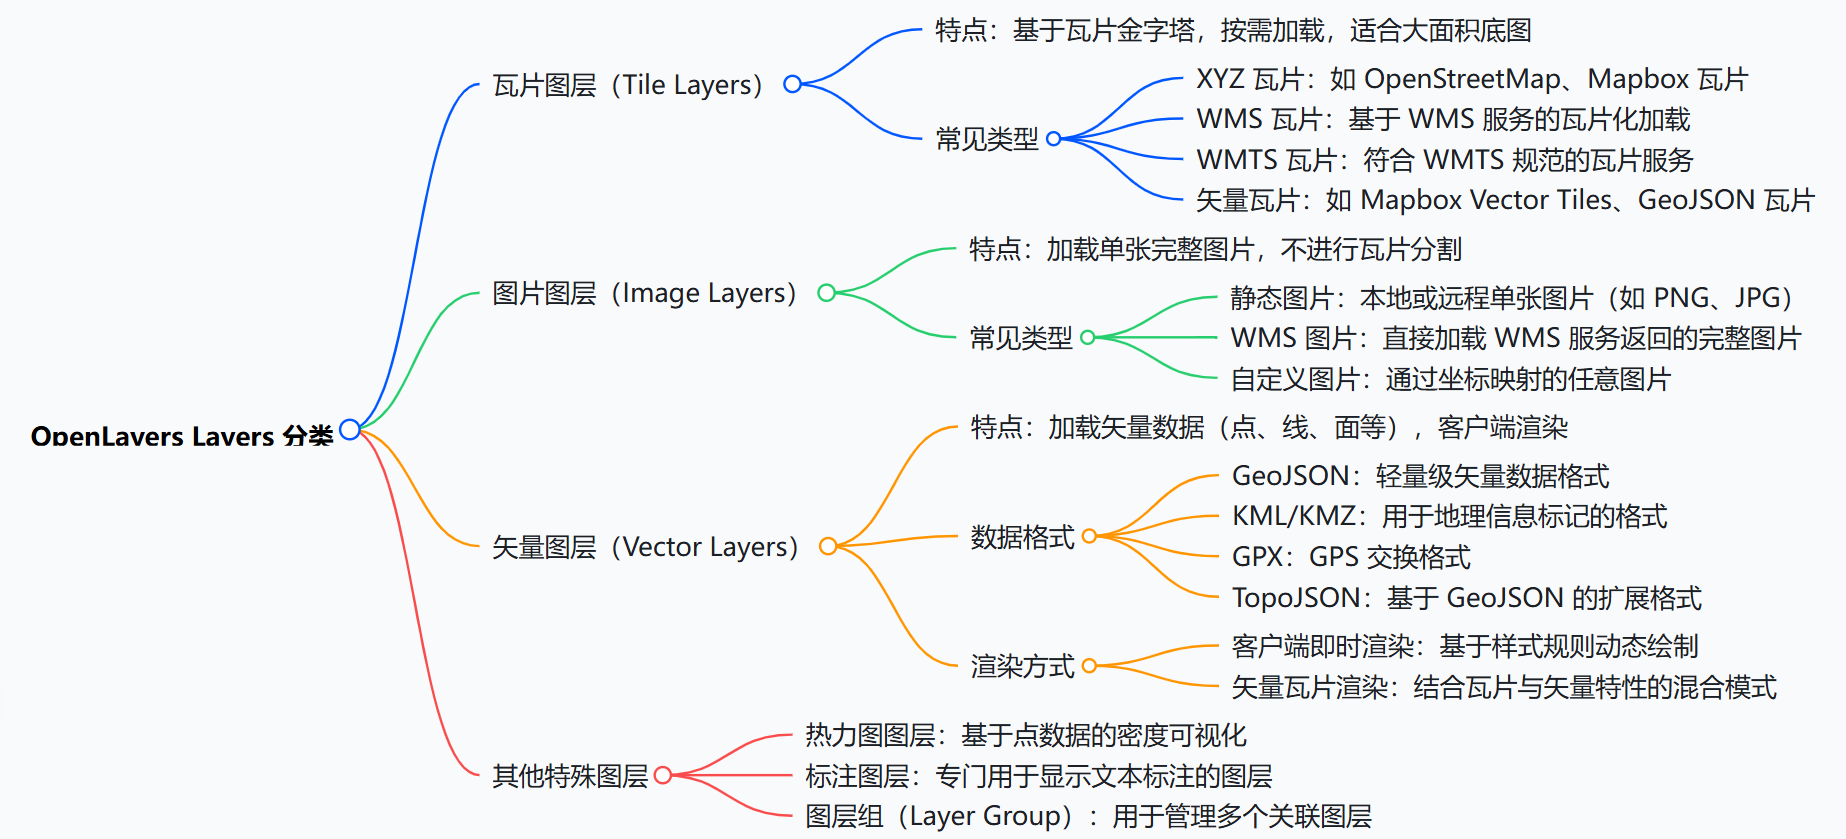
Layer 对象
OpenLayers 的图层系统负责数据渲染与可视化,是地图内容组织的核心单元。不同图层类型处理不同数据格式,配合 Source 和 Style 实现灵活的地图呈现。
核心概念:
- 每个图层必须绑定一个数据源(Source)
- 图层渲染顺序由
zIndex控制(值越大越靠上)- 可通过
minZoom/maxZoom控制可见缩放级别
图层类型速查
| 图层类型 | 类名 | 用途描述 |
|---|---|---|
| TileLayer (重要) | ol/layer/Tile | 加载瓦片地图(OSM/高德等) |
| VectorLayer (重要) | ol/layer/Vector | 渲染矢量要素(点/线/面) |
| ImageLayer | ol/layer/Image | 加载单张图片或 WMS 服务 |
| VectorTileLayer | ol/layer/VectorTile | 加载矢量瓦片(Mapbox 等) |
| HeatmapLayer | ol/layer/Heatmap | 热力图可视化 |
| GroupLayer | ol/layer/Group | 图层组管理 |
核心公共属性
| 属性名 | 类型 | 默认值 | 描述 |
|---|---|---|---|
source | ol.source.* | undefined | 必需,图层数据源 |
opacity | number | 1 | 透明度(0-1) |
visible | boolean | true | 是否可见 |
extent | Array<number> | undefined | 渲染范围 [minx, miny, maxx, maxy] |
zIndex | number | 0 | 图层叠放顺序(值大的在上层) |
minResolution | number | undefined | 最小分辨率(小于此值不显示) |
maxResolution | number | undefined | 最大分辨率(大于此值不显示) |
minZoom | number | undefined | 最小缩放级别(小于此级别不显示) |
maxZoom | number | undefined | 最大缩放级别(大于此级别不显示) |
className | string | 'ol-layer' | 图层容器的 CSS 类名 |
properties | Object | {} | 自定义属性(存储业务数据) |
核心公共方法
| 方法签名 | 返回值 | 描述 |
|---|---|---|
getOpacity() | number | 获取当前透明度 |
setOpacity(opacity) | void | 设置透明度(0-1) |
getVisible() | boolean | 获取可见状态 |
setVisible(visible) | void | 设置可见性 |
getExtent() | Array | 获取渲染范围 |
setExtent(extent) | void | 设置渲染范围 |
getZIndex() | number | 获取 zIndex 值 |
setZIndex(zIndex) | void | 设置 zIndex 值 |
getMinResolution() | number | 获取最小分辨率 |
setMinResolution(res) | void | 设置最小分辨率 |
getMaxResolution() | number | 获取最大分辨率 |
setMaxResolution(res) | void | 设置最大分辨率 |
getSource() | Source | 获取数据源实例 |
setSource(source) | void | 更换数据源 |
getProperties() | Object | 获取所有自定义属性 |
set(key, value) | void | 设置单个自定义属性 |
get(key) | any | 获取自定义属性值 |
js
const layer = new ol.layer.Tile({
  source: new ol.source.OSM(), // 数据源
  opacity: 0.5, // 透明度
  visible: false, // 可见性
  extent: [-180, -90, 180, 90], // 渲染范围
  zIndex: 100, // 叠加顺序
  minResolution: 0.00001, // 最小分辨率
  maxResolution: 0.0001, // 最大分辨率
  minZoom: 0, // 最小缩放级别
  maxZoom: 20, // 最大缩放级别
  className: "my-tile-layer", // CSS 类名
  properties: {
    id: "base-map",
    customProperty: "custom value",
  }, // 自定义属性
});
// 读取自定义属性
layer.get("id"); // 'base-map'

layer.getProperties(); // {id: 'base-map', customProperty: 'custom value'}

layer.getOpacity(); // 0.5

layer.getVisible(); // true
1. TileLayer - 瓦片图层
用于加载预切片的栅格地图服务(如 OSM、高德、天地图)。
特有属性
| 属性名 | 类型 | 默认值 | 描述 |
|---|---|---|---|
preload | number | 0 | 预加载瓦片层级数,0 表示不预加载 |
background | string | undefined | 背景色(瓦片间隙) |
TileSource - 数据源
瓦片图层数据源(Tile Source)负责提供瓦片地图的原始数据,定义了瓦片的获取方式、格式和加载策略。它是瓦片图层(TileLayer)的核心组成部分。
| 类型 | 类名 | 描述 | 引入路径 |
|---|---|---|---|
| OSM | ol/source/OSM | OpenStreetMap 瓦片 | import OSM from 'ol/source/OSM' |
| XYZ | ol/source/XYZ | 标准 XYZ 格式瓦片 | import XYZ from 'ol/source/XYZ' |
| WMTS | ol/source/WMTS | OGC WMTS 服务 | import WMTS from 'ol/source/WMTS' |
| WMS | ol/source/TileWMS | OGC WMS 服务(瓦片版) | import TileWMS from 'ol/source/TileWMS' |
OSM
js
// 加载 OpenStreetMap 瓦片
import TileLayer from "ol/layer/Tile";
import OSM from "ol/source/OSM";

const tileLayer = new TileLayer({
  source: new OSM({
    attributions: "© OpenStreetMap contributors",
    maxZoom: 19,
  }),
  opacity: 1, // 不透明度,0~1
  visible: true, // 是否可见
  zIndex: 0, // 图层顺序
});
XYZ
js
// 加载高德地图
import TileLayer from "ol/layer/Tile";
import XYZ from "ol/source/XYZ";

const tileLayer = new TileLayer({
  source: new XYZ({
    url: "https://webrd04.is.autonavi.com/appmaptile?lang=zh_cn&size=1&scale=1&style=7&x={x}&y={y}&z={z}",
  }),
  opacity: 1, // 不透明度,0~1
  visible: true, // 是否可见
  zIndex: 0, // 图层顺序
});
GeoServer WMS
js
import TileLayer from "ol/layer/Tile.js";
import TileWMS from "ol/source/TileWMS.js";

// http://localhost:8520/geoserver/tiger/wms?service=WMS&version=1.1.0&request=GetMap&layers=tiger%3Apoi&bbox=-74.0118315772888%2C40.70754683896324%2C-74.00153046439813%2C40.719885123828675&width=641&height=768&srs=EPSG%3A4326&styles=&format=application/openlayers
const wmsLayer = new TileLayer({
  source: new TileWMS({
    url: "http://localhost:8520/geoserver/tiger/wms",
    params: {
      LAYERS: "tiger:poi",
      VERSION: "1.1.0",
    },
  }),
});
map.addLayer(wmsLayer);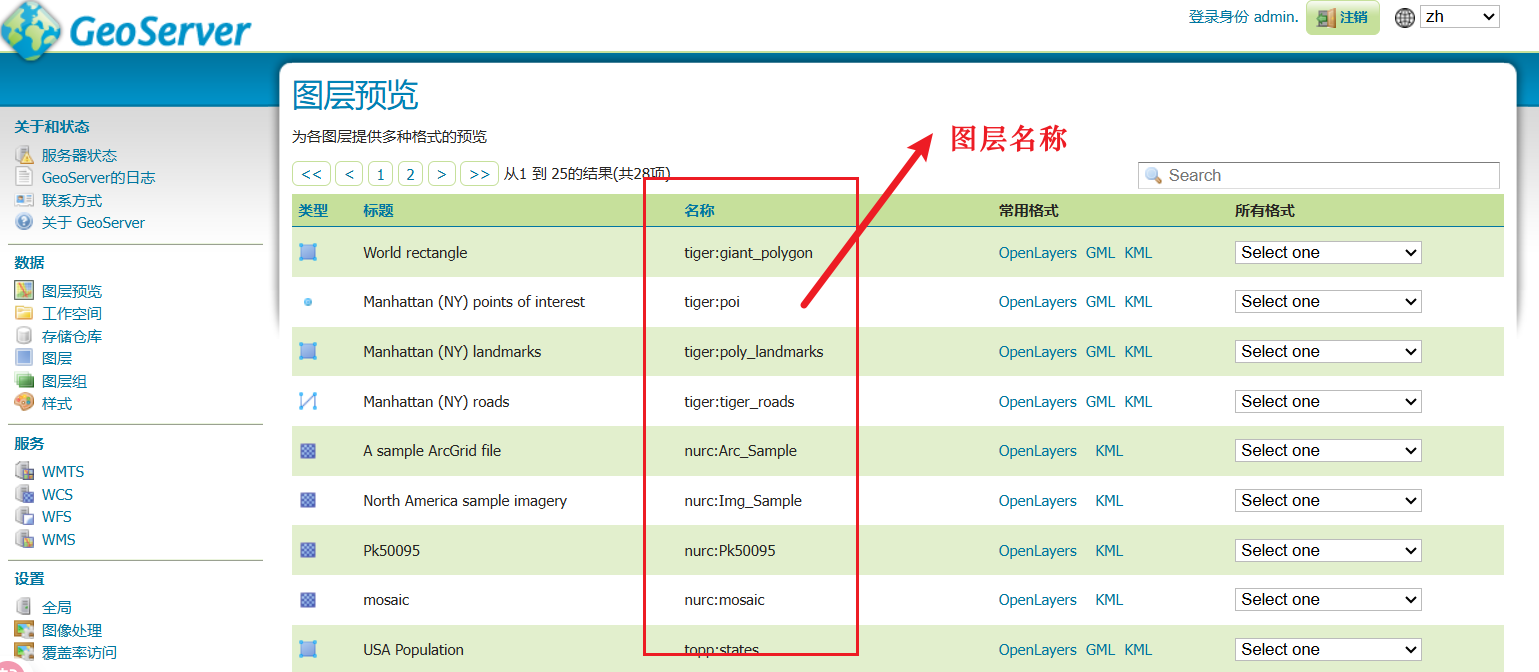
2. ImageLayer - 图片图层
用于显示单张静态图片或动态生成的图片(如 WMS 服务返回的图片)
ImageSource - 数据源
| 类型 | 类名 | 描述 |
|---|---|---|
| ImageStatic | ol/source/ImageStatic | 静态图片 |
| ImageWMS | ol/source/ImageWMS | WMS 服务图片 |
ImageStatic - 静态图像
js
import ImageLayer from "ol/layer/Image";
import Static from "ol/source/ImageStatic.js";

const imageLayer = new ImageLayer({
  source: new Static({
    url: "/src/assets/vue.svg", // 替换为你的图片路径
    imageExtent: [116.4074, 39.9042, 116.4174, 39.9142], // 图像在地图坐标中的范围
  }),
});
map.addLayer(imageLayer);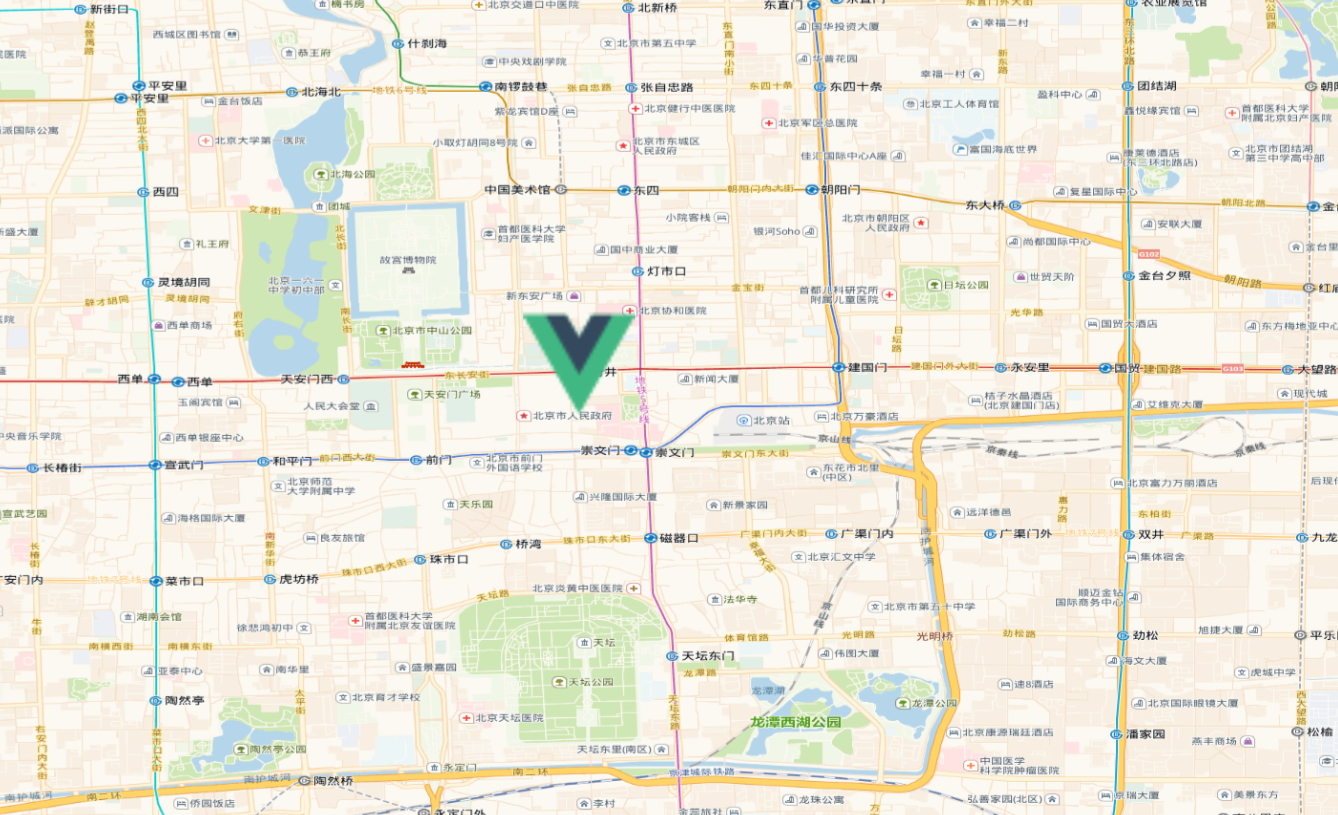
3. VectorLayer - 矢量图层(重点)
直接在客户端渲染矢量数据(点/线/面),支持动态修改和交互。
特有属性
| 属性名 | 类型 | 默认值 | 描述 |
|---|---|---|---|
style | Style|Function | undefined | 要素样式(支持动态函数) |
background | string | undefined | 背景色 |
- 复杂样式建议使用
StyleFunction动态计算
特有方法
| 方法名 | 返回值 | 描述 |
|---|---|---|
setStyle(style) | void | 设置图层样式 |
getStyle() | Style | 获取图层样式 |
VectorSource - 数据源
矢量图层数据源(Vector Source)负责提供矢量数据,定义了数据的获取方式、格式和加载策略。它是矢量图层(VectorLayer)的核心组成部分。
| 类型 | 介绍 |
|---|---|
| GeoJSON | 加载 GeoJSON 格式矢量数据 |
| KML | 加载 KML 格式矢量数据 |
| Vector | 加载矢量要素 |
VectorSource - 核心属性
| 属性 | 类型 | 默认值 | 描述 |
|---|---|---|---|
features | Array<Feature> | [] | 初始要素数组 |
url | string | null | 远程数据 URL |
format | ol.format.* | null | 数据解析格式(GeoJSON 等) |
loader | function | null | 自定义加载函数 |
strategy | LoadingStrategy | 加载策略(控制何时加载数据),默认一次性加载所有要素 | |
overlaps | boolean | true | 是否允许要素重叠(性能优化) |
useSpatialIndex | boolean | true | 是否启用空间索引(查询优化) |
wrapX | boolean | true | 是否在水平方向重复要素(适用于全球地图) |
VectorSource - 核心方法
| 方法名 | 返回值 | 描述 |
|---|---|---|
addFeature(feature) | void | 添加单个要素 |
addFeatures(features) | void | 添加多个要素 |
removeFeature(feature) | Feature | 移除单个要素(返回被移除的要素) |
removeFeatures(features) | void | 移除多个要素 |
getFeatureById(id) | Feature | 根据 ID 获取要素 |
getFeatures() | Array | 获取所有要素 |
getFeaturesInExtent(extent) | Array | 获取指定范围内的要素(需开启空间索引) |
getClosestFeatureToCoordinate(coordinate) | Feature | 根据坐标获取最近要素 |
forEachFeature(callback) | void | 遍历所有要素 |
forEachFeatureInExtent(extent, callback) | void | 在指定范围内遍历要素(需开启空间索引) |
clear() | void | 清除所有要素 |
矢量要素创建
- 以下为创建一个最基础的矢量要素(点),更多矢量图层属性参考矢量图形,
- 创建顺序为
Feature -> VectorSource(features 属性加载) -> VectorLayer
js
import Feature from "ol/Feature.js";
import Point from "ol/geom/Point.js";
import VectorLayer from "ol/layer/Vector.js";
import VectorSource from "ol/source/Vector.js";
import Style from "ol/style/Style";
import Fill from "ol/style/Fill";
import Stroke from "ol/style/Stroke";
import CircleStyle from "ol/style/Circle";
import Text from "ol/style/Text";

const feature = new Feature({
  geometry: new Point([116.4074, 39.9042]), // 北京市中心经纬度
  name: "北京中心",
});
const source = new VectorSource({
  features: [feature],
});
const layer = new VectorLayer({
  source: source,
  // 圆形标记
  style: new Style({
    image: new CircleStyle({
      radius: 20,
      fill: new Fill({ color: "red" }),
      stroke: new Stroke({ color: "white", width: 2 }),
    }),
    text: new Text({
      text: feature.get("name"), // 显示点的名称
      offsetY: -28, // 文本偏移
      fill: new Fill({ color: "black" }),
      stroke: new Stroke({ color: "white", width: 2 }),
    }),
  }),
});
map.addLayer(layer);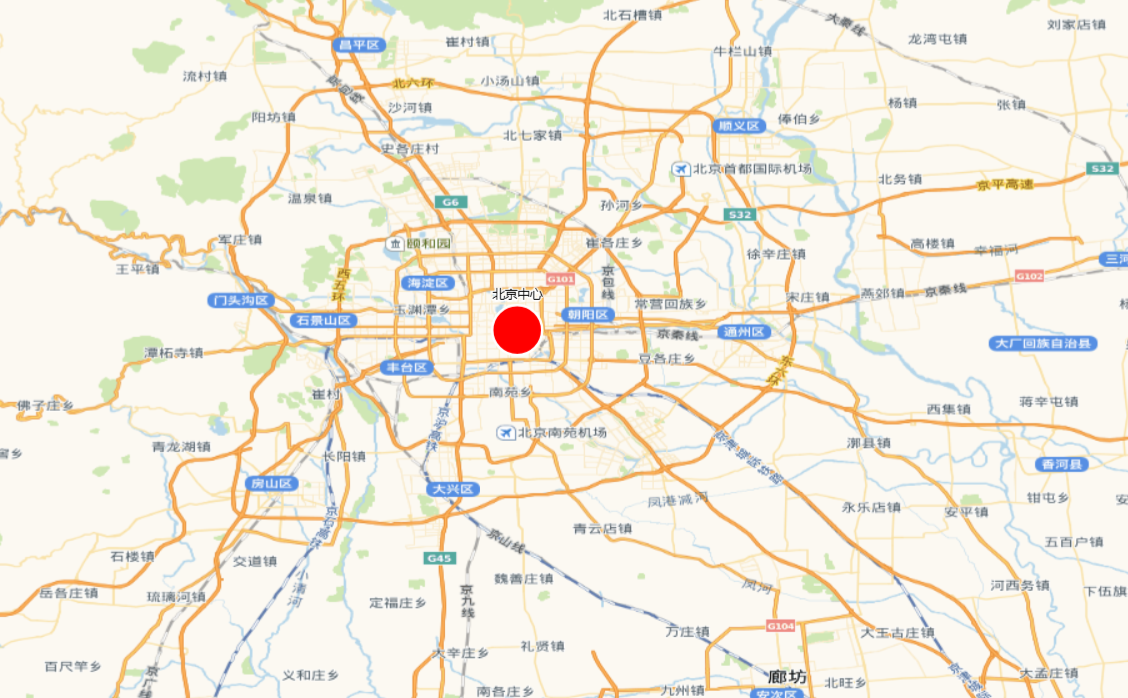
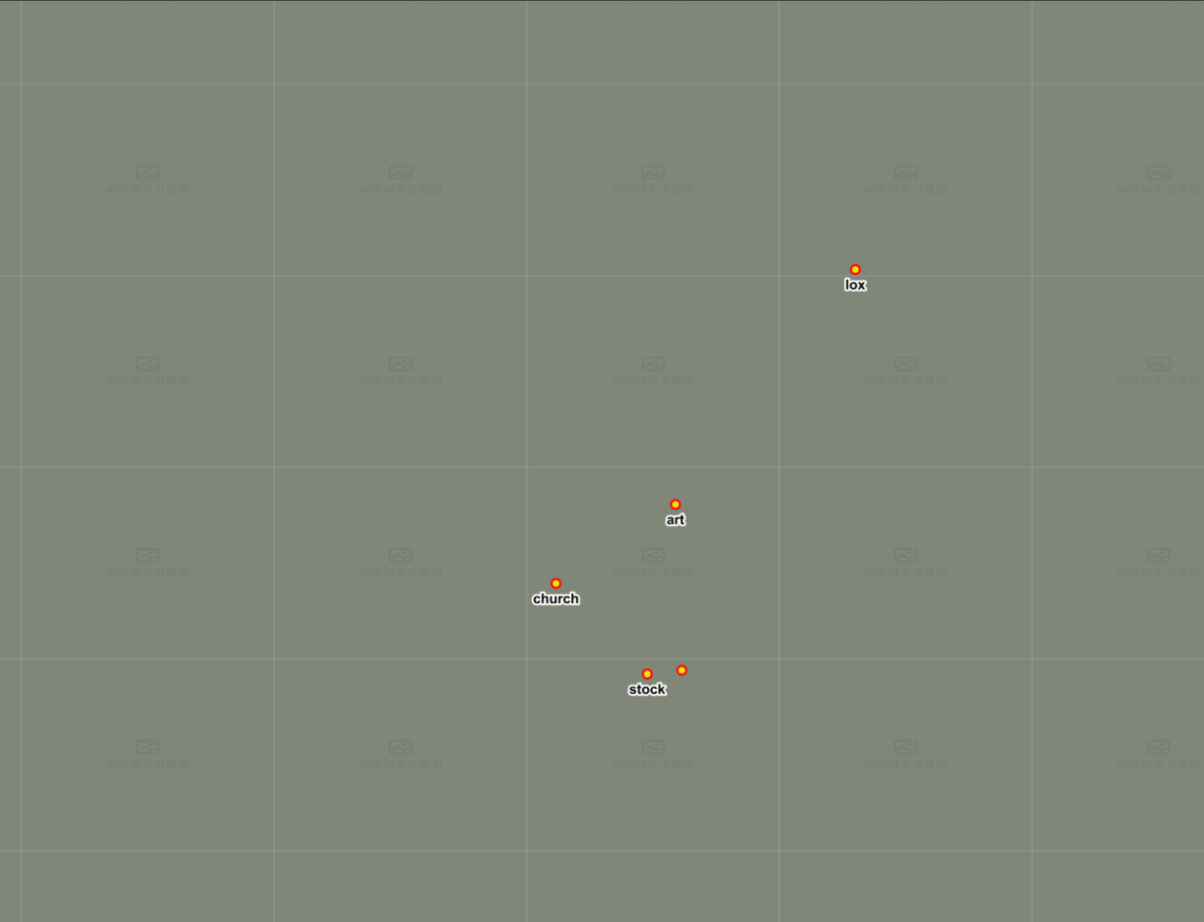
加载 Geojson
- 创建顺序为
VectorSource(url 属性加载) -> VectorLayer - format:数据解析格式,用于将 GeoJSON 数据转换为 OpenLayers 中的要素对象。
js
import GeoJSON from "ol/format/GeoJSON.js";
import VectorLayer from "ol/layer/Vector.js";
import VectorSource from "ol/source/Vector.js";
import Style from "ol/style/Style";
import Fill from "ol/style/Fill";
import Stroke from "ol/style/Stroke";

const geojsonLayer = new VectorLayer({
  source: new VectorSource({
    url: "https://geo.datav.aliyun.com/areas_v3/bound/320000_full.json", // 替换为你的GeoJSON数据URL
    format: new GeoJSON(), // 数据解析格式
  }),
  style: new Style({
    fill: new Fill({
      color: "rgba(255, 255, 0, 0.6)",
    }),
    stroke: new Stroke({
      color: "#ffcc33",
      width: 2,
    }),
  }),
});
map.addLayer(geojsonLayer);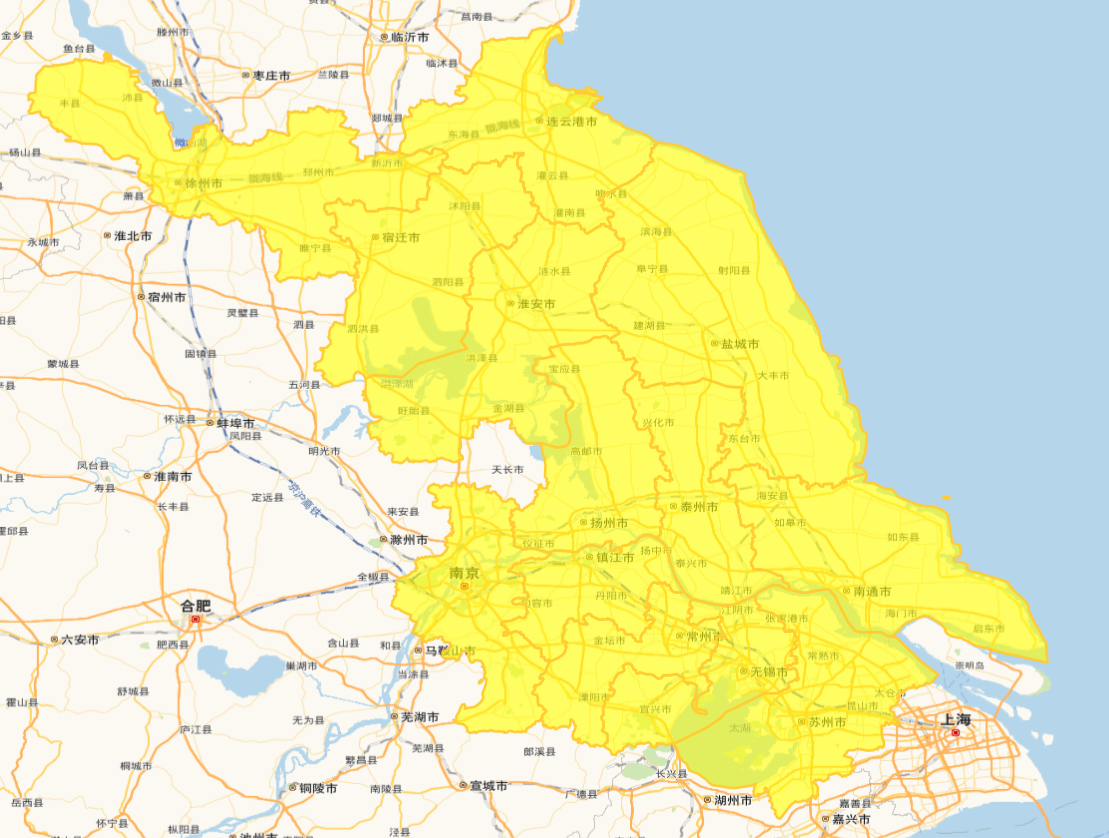
Style - 样式
控制矢量要素外观的核心机制,支持静态样式和动态样式函数。
基础样式组件
| 组件 | 作用 | 示例 |
|---|---|---|
Fill | 填充颜色 | new Fill({ color: 'red' }) |
Stroke | 描边样式 | new Stroke({ color: 'blue', width: 2 }) |
Circle | 圆形图标 | new Circle({ radius: 10, fill: ... }) |
Icon | 图片图标 | new Icon({ src: 'pin.png' }) |
Text | 文本标注 | new Text({ text: '北京', font: 'bold 14px sans-serif' }) |
RegularShape | 自定义形状 | new RegularShape({ radius: 10, fill: ... }) |
基本样式
js
import { Style, Fill, Stroke, Circle, Text } from "ol/style";

const pointStyle = new Style({
  image: new Circle({
    radius: 10, // 半径
    fill: new Fill({ color: "red" }), // 填充颜色
  }),
  text: new Text({
    text: "标记点", // 文本内容
    font: "bold 14px sans-serif", // 字体样式
    fill: new Fill({ color: "black" }), // 文本填充颜色
    offsetY: -20, // 文本垂直偏移
    stroke: new Stroke({
      color: "white", // 文本描边颜色
      width: 2, // 文本描边宽度
    }),
    rotation: Math.PI / 4, // 文本旋转角度(弧度)
  }),
  stroke: new Stroke({
    color: "blue",
    width: 3,
    lineDash: [10, 5], // 虚线模式
  }),
  fill: new Fill({
    color: "rgba(0, 255, 0, 0.3)", // 带透明度的绿色
  }),
});
动态样式
每次视图变化时都会重新计算样式,适用于需要根据视图状态调整样式的情况。
js
// 设置动态样式函数
const getStyle = (feature, resolution) => {
const size = resolution < 100 ? 10 : 5;
return new Style({
image: new CircleStyle({
radius: size,
fill: new Fill({ color: "blue" }),
}),
});
};
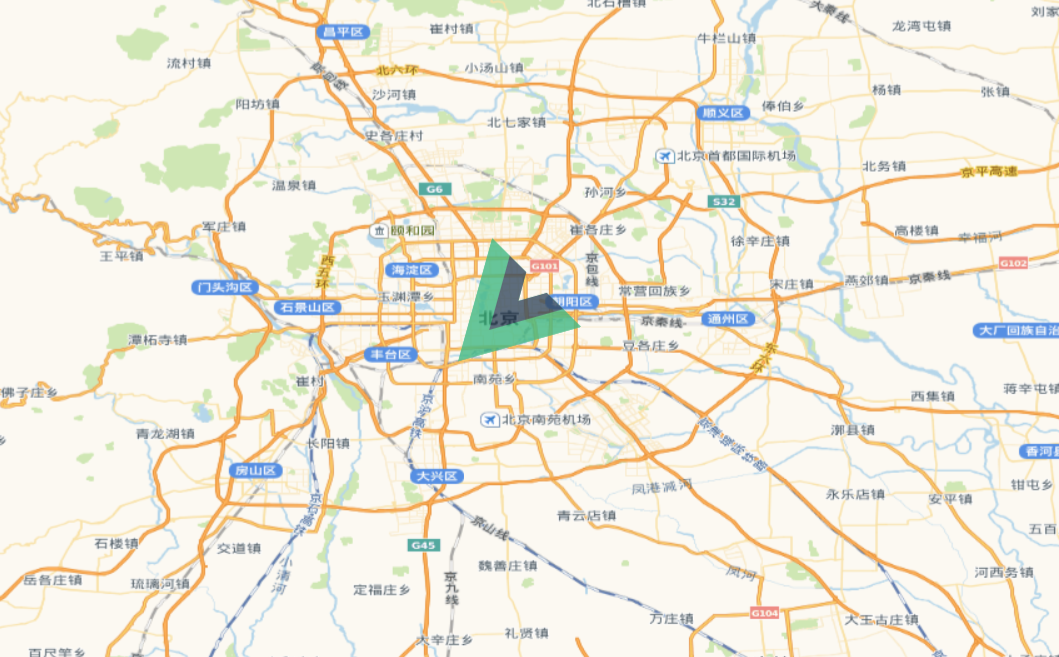
vectorLayer.setStyle(getStyle);图标样式
js
import { Style, Icon } from "ol/style";

const iconStyle = new Style({
  image: new Icon({
    src: "/src/assets/vue.svg", // 使用本地图片
    // scale: 1, // 缩放比例
    width: 60, // 图标的像素宽度,不能与 scale 一起使用。
    height: 60, // 图标的像素高度,不能与 scale 一起使用。
    rotation: Math.PI / 4, // 旋转角度(弧度)
    anchor: [0.5, 0.5], // 锚点位置(图标中心)
    opacity: 0.8, // 图标透明度
    rotateWithView: false, // 是否随视图旋转图标
  }),
});
4. VectorTileLayer - 矢量瓦片图层
加载矢量瓦片(如 Mapbox Vector Tiles),在客户端动态渲染样式。
js
import VectorTileLayer from "ol/layer/VectorTile";
import VectorTileSource from "ol/source/VectorTile";
import MVT from "ol/format/MVT";

const vectorTileLayer = new VectorTileLayer({
  source: new VectorTileSource({
    format: new MVT(),
    url: "https://your-server/tiles/{z}/{x}/{y}.pbf",
  }),
});
5. HeatmapLayer - 热力图层
将点数据转换为热力图,表现密度分布。
特有属性
| 属性名 | 类型 | 默认值 | 描述 |
|---|---|---|---|
blur | number | 15 | 模糊半径(像素) |
radius | number | 8 | 点半径(像素) |
gradient | Array<string> | ['#00f','#0ff','#0f0','#ff0','#f00'] | 颜色渐变数组 |
weight | string|function | 'weight' | 权重字段/计算函数 |
数据源必须包含点要素
js
import Heatmap from "ol/layer/Heatmap";
import VectorSource from "ol/source/Vector";
import Feature from "ol/Feature";
import Point from "ol/geom/Point";

// 随机生成1000个点
const features = [];
for (let i = 0; i < 1000; i++) {
  const randomLon = 116.4074 + (Math.random() - 0.5) * 0.01; // 随机生成纬度
  const randomLat = 39.9042 + (Math.random() - 0.5) * 0.01; // 随机生成经度
  const feature = new Feature({
    geometry: new Point([randomLon, randomLat]),
  });
  features.push(feature);
}
// 创建一个矢量图层
const heatmapLayer = new Heatmap({
  source: new VectorSource({
    features,
  }),
});
map.addLayer(heatmapLayer);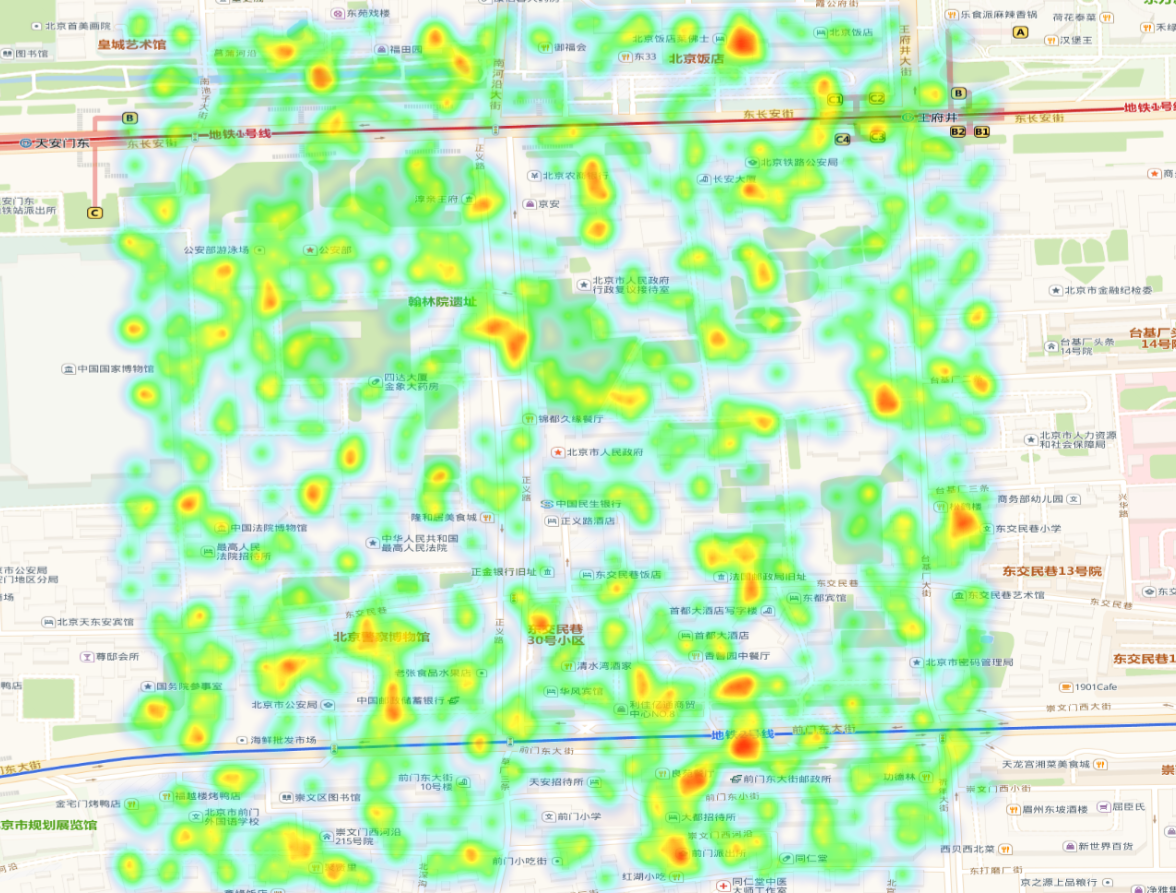
6. GroupLayer - 图层组
管理多个图层的容器,可统一控制组内所有图层。
核心方法
| 方法名 | 描述 |
|---|---|
| getLayers() | 获取组中的所有图层数组 |
| setLayers(layers) | 设置组中的图层数组 |
| getVisible() | 获取组的可见性 |
| setVisible(visible) | 设置组的可见性 |
| getOpacity() | 获取组的透明度 |
| setOpacity(opacity) | 设置组的透明度 |
| getZIndex() | 获取图层组叠放顺序 |
| setZIndex(zIndex) | 设置图层组叠放顺序 |
| getExtent() | 获取组的范围(范围) |
| getMinResolution() | 获取组的最小分辨率 |
| getMaxResolution() | 获取组的最大分辨率 |
| getMinZoom() | 获取组的最小缩放级别 |
| getMaxZoom() | 获取组的最大缩放级别 |
js
import LayerGroup from "ol/layer/Group";

const groupLayer = new LayerGroup({
  layers: [tileLayer, vectorLayer],
});
添加图层到组
js
// 方法1:创建时添加
const group = new LayerGroup({
  layers: [layer1, layer2],
});

// 方法2:通过集合添加
group.getLayers().push(layer3);

// 方法3:插入指定位置
group.getLayers().insertAt(0, layer0); // 插入到首位

// 方法4:添加多个图层
group.getLayers().extend([layer4, layer5]);