案例 综合案例_绘制图层
先说报错:
当前 leaflet 1.9.4 版本使用 npm 下载 leaflet-draw 会出现部分 bug,下面视频中会展示出来
解决办法:
使用 cdn 引入可以正常使用,Vite+Vue 中同理,在 index.html 中引入 cdn 资源
bash
  # 引入Leaflet CSS
  <link rel="stylesheet" href="https://unpkg.com/leaflet@1.9.4/dist/leaflet.css" />
  # 引入Leaflet Draw CSS
  <link rel="stylesheet" href="https://cdnjs.cloudflare.com/ajax/libs/leaflet.draw/1.0.4/leaflet.draw.css" />
  # 引入Leaflet JS
  <script src="https://unpkg.com/leaflet@1.9.4/dist/leaflet.js"></script>
  # 引入Leaflet Draw JS
  <script src="https://cdnjs.cloudflare.com/ajax/libs/leaflet.draw/1.0.4/leaflet.draw.js"></script>
Vue 下载依赖
该案例存在问题,矩形绘制无效,详见视频
bash
npm install leaflet-draw展开代码
vue
<template>
<div class="map-wrapper">
<div class="control-panel">
<div class="info-display">
<p>
最近绘制的图形类型: <strong>{{ lastDrawnType || "无" }}</strong>
</p>
<p>
绘制的图形数量: <strong>{{ drawnItemsCount }}</strong>
</p>
</div>
<button @click="clearAllDrawings" class="action-button clear-button">
清除所有绘制
</button>
<button @click="resetMapView" class="reset-button">重置地图视图</button>
</div>
<div id="map-drawing" class="map-container"></div>
</div>
</template>
<script setup>
import { ref, onMounted, onUnmounted } from "vue";
import "leaflet/dist/leaflet.css";
import "leaflet-draw/dist/leaflet.draw.css"; // Leaflet.draw 插件的CSS
import L from "leaflet";
import "leaflet-draw"; // 引入 Leaflet.draw 插件JS
let map = null;
let drawnItems = null; // 用于存储绘制的图层
let drawControl = null; // 绘制工具控制器
const lastDrawnType = ref("");
const drawnItemsCount = ref(0);
const initialView = [39.909186, 116.397479];
const initialZoom = 12;
onMounted(() => {
map = L.map("map-drawing").setView(initialView, initialZoom);
L.tileLayer(
"https://webrd01.is.autonavi.com/appmaptile?lang=zh_cn&size=1&scale=1&style=8&x={x}&y={y}&z={z}",
{
maxZoom: 18,
minZoom: 3,
attribution: '© <a href="https://www.amap.com/">高德地图</a>',
}
).addTo(map);
// 初始化绘制图层组,用于存储用户绘制的图形
drawnItems = new L.FeatureGroup();
map.addLayer(drawnItems);
// 初始化绘制工具控制器
drawControl = new L.Control.Draw({
edit: {
featureGroup: drawnItems, // 指定可编辑的图层组
remove: true, // 允许删除
},
draw: {
polyline: {
shapeOptions: {
color: "#f357a1",
weight: 10,
},
},
polygon: {
allowIntersection: false, // Restricts shapes to simple polygons
drawError: {
color: "#e1e100", // Color the shape will turn when intersects
message: "<strong>Oh snap!<strong> you can't draw that!", // Message that will show when intersect
},
shapeOptions: {
color: "#bada55",
},
},
circle: {
shapeOptions: {
weight: 5,
color: "#000",
},
},
rectangle: {
shapeOptions: {
clickable: false,
},
},
marker: true,
},
});
map.addControl(drawControl);
// 监听绘制完成事件
map.on(L.Draw.Event.CREATED, (e) => {
const type = e.layerType;
const layer = e.layer;
// 将绘制的图层添加到 drawnItems 图层组
drawnItems.addLayer(layer);
lastDrawnType.value = type;
drawnItemsCount.value = drawnItems.getLayers().length;
// 打印绘制的GeoJSON数据
console.log(`绘制了 ${type} 类型图形:`, layer.toGeoJSON());
});
// 监听删除事件
map.on(L.Draw.Event.DELETED, (e) => {
drawnItemsCount.value = drawnItems.getLayers().length;
console.log("图形被删除:", e.layers);
});
});
onUnmounted(() => {
if (map) {
map.off(L.Draw.Event.CREATED);
map.off(L.Draw.Event.DELETED);
map.removeControl(drawControl); // 移除绘制控制器
map.remove();
map = null;
drawnItems = null;
drawControl = null;
}
});
const clearAllDrawings = () => {
if (drawnItems) {
drawnItems.clearLayers(); // 清除所有绘制的图层
lastDrawnType.value = "";
drawnItemsCount.value = 0;
console.log("所有绘制已清除。");
}
};
const resetMapView = () => {
if (map) {
map.setView(initialView, initialZoom);
}
};
</script>
<style scoped>
.map-wrapper {
display: flex;
flex-direction: column;
height: 100vh;
width: 100vw;
font-family: sans-serif;
box-sizing: border-box;
}
@media (min-width: 768px) {
.map-wrapper {
flex-direction: row;
}
}
.control-panel {
flex-shrink: 0;
width: 100%;
background-color: #f8f8f8;
border-right: 1px solid #eee;
box-shadow: 2px 0 5px rgba(0, 0, 0, 0.1);
display: flex;
flex-direction: column;
gap: 15px;
}
@media (min-width: 768px) {
.control-panel {
width: 280px;
height: 100%;
}
}
.info-display {
background-color: #e9ecef;
padding: 15px;
border-radius: 8px;
border: 1px solid #dee2e6;
color: #495057;
}
.info-display p {
margin: 5px 0;
font-size: 0.95em;
}
.info-display strong {
color: #007bff;
}
.map-container {
flex-grow: 1;
height: 100%;
min-height: 300px;
background-color: #e0e0e0;
}
.action-button {
padding: 10px 15px;
border: none;
border-radius: 5px;
cursor: pointer;
font-size: 1em;
transition: background-color 0.3s ease;
}
.clear-button {
background-color: #dc3545;
color: white;
}
.clear-button:hover {
background-color: #c82333;
}
.reset-button {
background-color: #007bff;
color: white;
margin-top: auto; /* 将按钮推到底部 */
}
.reset-button:hover {
background-color: #0056b3;
}
.reset-button:active {
background-color: #004085;
}
</style>Vue 使用 CDN 正常
html 展开代码
html
<!DOCTYPE html>
<html lang="en">
  <head>
    <meta charset="UTF-8" />
    <link rel="icon" type="image/svg+xml" href="/vite.svg" />
    <meta name="viewport" content="width=device-width, initial-scale=1.0" />
    <title>Vite + Vue</title>
    <!-- 引入Leaflet CSS -->
    <link
      rel="stylesheet"
      href="https://unpkg.com/leaflet@1.9.4/dist/leaflet.css"
    />
    <!-- 引入Leaflet Draw CSS -->
    <link
      rel="stylesheet"
      href="https://cdnjs.cloudflare.com/ajax/libs/leaflet.draw/1.0.4/leaflet.draw.css"
    />
    <!-- 引入Leaflet JS -->
    <script src="https://unpkg.com/leaflet@1.9.4/dist/leaflet.js"></script>
    <!-- 引入Leaflet Draw JS -->
    <script src="https://cdnjs.cloudflare.com/ajax/libs/leaflet.draw/1.0.4/leaflet.draw.js"></script>
  </head>

  <body>
    <div id="app"></div>
    <script type="module" src="/src/main.js"></script>
  </body>
</html>
vue 展开代码
vue
<template>
<div class="map-wrapper">
<div class="control-panel">
<div class="info-display">
<p>
最近绘制的图形类型: <strong>{{ lastDrawnType || "无" }}</strong>
</p>
<p>
绘制的图形数量: <strong>{{ drawnItemsCount }}</strong>
</p>
</div>
<button @click="clearAllDrawings" class="action-button clear-button">
清除所有绘制
</button>
<button @click="resetMapView" class="reset-button">重置地图视图</button>
</div>
<div id="map-drawing" class="map-container"></div>
</div>
</template>
<script setup>
import { ref, onMounted, onUnmounted } from "vue";
// import "leaflet/dist/leaflet.css";
// import "leaflet-draw/dist/leaflet.draw.css"; // Leaflet.draw 插件的CSS
// import L from "leaflet";
// import "leaflet-draw"; // 引入 Leaflet.draw 插件JS
let map = null;
let drawnItems = null; // 用于存储绘制的图层
let drawControl = null; // 绘制工具控制器
const lastDrawnType = ref("");
const drawnItemsCount = ref(0);
const initialView = [39.909186, 116.397479];
const initialZoom = 12;
onMounted(() => {
map = L.map("map-drawing").setView(initialView, initialZoom);
L.tileLayer(
"https://webrd01.is.autonavi.com/appmaptile?lang=zh_cn&size=1&scale=1&style=8&x={x}&y={y}&z={z}",
{
maxZoom: 18,
minZoom: 3,
attribution: '© <a href="https://www.amap.com/">高德地图</a>',
}
).addTo(map);
// 初始化绘制图层组,用于存储用户绘制的图形
drawnItems = new L.FeatureGroup();
map.addLayer(drawnItems);
// 初始化绘制工具控制器
drawControl = new L.Control.Draw({
edit: {
featureGroup: drawnItems, // 指定可编辑的图层组
remove: true, // 允许删除
},
draw: {
polyline: {
shapeOptions: {
color: "#f357a1",
weight: 10,
},
},
polygon: {
allowIntersection: false, // Restricts shapes to simple polygons
drawError: {
color: "#e1e100", // Color the shape will turn when intersects
message: "<strong>Oh snap!<strong> you can't draw that!", // Message that will show when intersect
},
shapeOptions: {
color: "#bada55",
},
},
circle: {
shapeOptions: {
weight: 5,
color: "#000",
},
},
rectangle: {
shapeOptions: {
clickable: false,
},
},
marker: true,
},
});
map.addControl(drawControl);
// 监听绘制完成事件
map.on(L.Draw.Event.CREATED, (e) => {
const type = e.layerType;
const layer = e.layer;
// 将绘制的图层添加到 drawnItems 图层组
drawnItems.addLayer(layer);
lastDrawnType.value = type;
drawnItemsCount.value = drawnItems.getLayers().length;
// 打印绘制的GeoJSON数据
console.log(`绘制了 ${type} 类型图形:`, layer.toGeoJSON());
});
// 监听删除事件
map.on(L.Draw.Event.DELETED, (e) => {
drawnItemsCount.value = drawnItems.getLayers().length;
console.log("图形被删除:", e.layers);
});
});
onUnmounted(() => {
if (map) {
map.off(L.Draw.Event.CREATED);
map.off(L.Draw.Event.DELETED);
map.removeControl(drawControl); // 移除绘制控制器
map.remove();
map = null;
drawnItems = null;
drawControl = null;
}
});
const clearAllDrawings = () => {
if (drawnItems) {
drawnItems.clearLayers(); // 清除所有绘制的图层
lastDrawnType.value = "";
drawnItemsCount.value = 0;
console.log("所有绘制已清除。");
}
};
const resetMapView = () => {
if (map) {
map.setView(initialView, initialZoom);
}
};
</script>
<style scoped>
.map-wrapper {
display: flex;
flex-direction: column;
height: 100vh;
width: 100vw;
font-family: sans-serif;
box-sizing: border-box;
}
@media (min-width: 768px) {
.map-wrapper {
flex-direction: row;
}
}
.control-panel {
flex-shrink: 0;
width: 100%;
background-color: #f8f8f8;
border-right: 1px solid #eee;
box-shadow: 2px 0 5px rgba(0, 0, 0, 0.1);
display: flex;
flex-direction: column;
gap: 15px;
}
@media (min-width: 768px) {
.control-panel {
width: 280px;
height: 100%;
}
}
.info-display {
background-color: #e9ecef;
padding: 15px;
border-radius: 8px;
border: 1px solid #dee2e6;
color: #495057;
}
.info-display p {
margin: 5px 0;
font-size: 0.95em;
}
.info-display strong {
color: #007bff;
}
.map-container {
flex-grow: 1;
height: 100%;
min-height: 300px;
background-color: #e0e0e0;
}
.action-button {
padding: 10px 15px;
border: none;
border-radius: 5px;
cursor: pointer;
font-size: 1em;
transition: background-color 0.3s ease;
}
.clear-button {
background-color: #dc3545;
color: white;
}
.clear-button:hover {
background-color: #c82333;
}
.reset-button {
background-color: #007bff;
color: white;
margin-top: auto; /* 将按钮推到底部 */
}
.reset-button:hover {
background-color: #0056b3;
}
.reset-button:active {
background-color: #004085;
}
</style>HTML
使用 html,使用 cdn 引入反而可以正常绘制,从这里,我就开始怀疑是不是依赖的问题,后续测试了下,果然是依赖存在问题
展开代码
html
<!DOCTYPE html>
<html lang="zh-CN">
<head>
<meta charset="UTF-8" />
<meta name="viewport" content="width=device-width, initial-scale=1.0" />
<title>Vue3 + Leaflet 地图绘制功能</title>
<!-- 引入Leaflet CSS -->
<link
rel="stylesheet"
href="https://unpkg.com/leaflet@1.9.4/dist/leaflet.css"
/>
<!-- 引入Leaflet Draw CSS -->
<link
rel="stylesheet"
href="https://cdnjs.cloudflare.com/ajax/libs/leaflet.draw/1.0.4/leaflet.draw.css"
/>
<!-- 引入Font Awesome图标 -->
<link
rel="stylesheet"
href="https://cdnjs.cloudflare.com/ajax/libs/font-awesome/6.4.0/css/all.min.css"
/>
<script src="https://unpkg.com/vue@3/dist/vue.global.js"></script>
<!-- 引入Leaflet JS -->
<script src="https://unpkg.com/leaflet@1.9.4/dist/leaflet.js"></script>
<!-- 引入Leaflet Draw JS -->
<script src="https://cdnjs.cloudflare.com/ajax/libs/leaflet.draw/1.0.4/leaflet.draw.js"></script>
<style>
* {
margin: 0;
padding: 0;
box-sizing: border-box;
font-family: "Segoe UI", Tahoma, Geneva, Verdana, sans-serif;
}
body {
background: linear-gradient(135deg, #1a2a6c, #b21f1f, #1a2a6c);
min-height: 100vh;
display: flex;
justify-content: center;
align-items: center;
padding: 20px;
}
#app {
width: 100%;
max-width: 1200px;
background-color: rgba(255, 255, 255, 0.95);
border-radius: 20px;
box-shadow: 0 15px 30px rgba(0, 0, 0, 0.3);
overflow: hidden;
display: flex;
flex-direction: column;
height: 90vh;
}
.app-header {
background: linear-gradient(to right, #1a2a6c, #b21f1f);
color: white;
padding: 20px;
text-align: center;
}
.app-header h1 {
font-size: 2.2rem;
margin-bottom: 10px;
}
.app-header p {
font-size: 1.1rem;
opacity: 0.9;
max-width: 800px;
margin: 0 auto;
}
.app-container {
display: flex;
flex: 1;
overflow: hidden;
}
.map-container {
flex: 1;
position: relative;
}
#map {
height: 100%;
width: 100%;
z-index: 1;
}
.controls-panel {
width: 320px;
background: #f8f9fa;
border-left: 1px solid #dee2e6;
padding: 20px;
overflow-y: auto;
display: flex;
flex-direction: column;
}
.panel-section {
margin-bottom: 25px;
background: white;
border-radius: 10px;
box-shadow: 0 4px 6px rgba(0, 0, 0, 0.05);
padding: 20px;
border-left: 4px solid #1a2a6c;
}
.panel-section h2 {
color: #1a2a6c;
margin-bottom: 15px;
font-size: 1.4rem;
display: flex;
align-items: center;
gap: 10px;
}
.panel-section h2 i {
font-size: 1.2rem;
}
.draw-buttons {
display: grid;
grid-template-columns: repeat(2, 1fr);
gap: 12px;
}
.draw-btn {
padding: 12px;
background: #1a2a6c;
color: white;
border: none;
border-radius: 8px;
cursor: pointer;
font-weight: 600;
display: flex;
flex-direction: column;
align-items: center;
justify-content: center;
transition: all 0.3s ease;
}
.draw-btn i {
font-size: 1.5rem;
margin-bottom: 8px;
}
.draw-btn:hover {
background: #b21f1f;
transform: translateY(-2px);
}
.draw-btn.active {
background: #b21f1f;
box-shadow: 0 0 0 3px rgba(178, 31, 31, 0.3);
}
.features-list {
max-height: 300px;
overflow-y: auto;
}
.feature-item {
padding: 12px;
margin-bottom: 10px;
background: #e9ecef;
border-radius: 8px;
display: flex;
justify-content: space-between;
align-items: center;
}
.feature-item .feature-info {
flex: 1;
}
.feature-item .feature-actions {
display: flex;
gap: 8px;
}
.feature-btn {
background: #1a2a6c;
color: white;
border: none;
border-radius: 5px;
padding: 6px 10px;
cursor: pointer;
transition: background 0.2s;
}
.feature-btn:hover {
background: #b21f1f;
}
.feature-btn.delete {
background: #dc3545;
}
.feature-btn.delete:hover {
background: #bd2130;
}
.coordinate-box {
background: #e9ecef;
padding: 15px;
border-radius: 8px;
font-family: monospace;
font-size: 0.9rem;
max-height: 150px;
overflow-y: auto;
}
.coordinates {
line-height: 1.6;
}
.stat-box {
display: flex;
justify-content: space-between;
background: #1a2a6c;
color: white;
padding: 15px;
border-radius: 8px;
margin-top: auto;
}
.stat-item {
text-align: center;
}
.stat-value {
font-size: 1.8rem;
font-weight: bold;
}
.stat-label {
font-size: 0.9rem;
opacity: 0.8;
}
.map-legend {
position: absolute;
bottom: 20px;
right: 20px;
background: rgba(255, 255, 255, 0.9);
padding: 10px;
border-radius: 8px;
box-shadow: 0 0 15px rgba(0, 0, 0, 0.2);
z-index: 1000;
font-size: 14px;
}
.legend-title {
font-weight: bold;
margin-bottom: 8px;
text-align: center;
color: #1a2a6c;
}
.legend-item {
display: flex;
align-items: center;
margin: 5px 0;
}
.legend-color {
width: 20px;
height: 20px;
margin-right: 8px;
border-radius: 4px;
}
@media (max-width: 768px) {
.app-container {
flex-direction: column;
}
.controls-panel {
width: 100%;
height: 40%;
}
.map-container {
height: 60%;
}
.draw-buttons {
grid-template-columns: repeat(3, 1fr);
}
}
</style>
</head>
<body>
<div id="app">
<div class="app-header">
<h1>
<i class="fas fa-map-marked-alt"></i> Vue3 + Leaflet 地图绘制工具
</h1>
<p>
使用Leaflet和Leaflet-Draw插件创建交互式地图绘制应用。绘制点、线、面等地理要素并管理它们。
</p>
</div>
<div class="app-container">
<div class="map-container">
<div id="map"></div>
<div class="map-legend">
<div class="legend-title">图例</div>
<div class="legend-item">
<div
class="legend-color"
style="background-color: #ff7800;"
></div>
<span>点标记</span>
</div>
<div class="legend-item">
<div
class="legend-color"
style="background-color: #3388ff;"
></div>
<span>线条</span>
</div>
<div class="legend-item">
<div
class="legend-color"
style="background-color: #33a02c;"
></div>
<span>多边形</span>
</div>
<div class="legend-item">
<div
class="legend-color"
style="background-color: #e31a1c;"
></div>
<span>矩形</span>
</div>
<div class="legend-item">
<div
class="legend-color"
style="background-color: #6a3d9a;"
></div>
<span>圆形</span>
</div>
</div>
</div>
<div class="controls-panel">
<div class="panel-section">
<h2><i class="fas fa-pencil-alt"></i> 绘制工具</h2>
<div class="draw-buttons">
<button class="draw-btn" @click="activateDrawTool('marker')">
<i class="fas fa-map-marker-alt"></i>
<span>点标记</span>
</button>
<button class="draw-btn" @click="activateDrawTool('polyline')">
<i class="fas fa-draw-polygon"></i>
<span>线条</span>
</button>
<button class="draw-btn" @click="activateDrawTool('polygon')">
<i class="fas fa-draw-polygon"></i>
<span>多边形</span>
</button>
<button class="draw-btn" @click="activateDrawTool('rectangle')">
<i class="fas fa-vector-square"></i>
<span>矩形</span>
</button>
<button class="draw-btn" @click="activateDrawTool('circle')">
<i class="fas fa-circle"></i>
<span>圆形</span>
</button>
<button class="draw-btn" @click="deactivateDrawTool">
<i class="fas fa-times"></i>
<span>取消绘制</span>
</button>
</div>
</div>
<div class="panel-section">
<h2><i class="fas fa-layer-group"></i> 已绘制要素</h2>
<div class="features-list">
<div
v-for="(feature, index) in drawnItems"
:key="feature.id"
class="feature-item"
>
<div class="feature-info">
<strong>{{ getFeatureType(feature) }}</strong>
<div>ID: {{ feature.id.slice(0, 8) }}</div>
</div>
<div class="feature-actions">
<button class="feature-btn" @click="zoomToFeature(feature)">
<i class="fas fa-search"></i>
</button>
<button
class="feature-btn delete"
@click="removeFeature(feature)"
>
<i class="fas fa-trash"></i>
</button>
</div>
</div>
<div
v-if="drawnItems.length === 0"
class="feature-item"
style="justify-content: center;"
>
暂无绘制要素
</div>
</div>
</div>
<div class="panel-section">
<h2><i class="fas fa-map-marker"></i> 当前坐标</h2>
<div class="coordinate-box">
<div class="coordinates">经度: {{ currentLng }}</div>
<div class="coordinates">纬度: {{ currentLat }}</div>
<div class="coordinates">缩放级别: {{ currentZoom }}</div>
</div>
</div>
<div class="stat-box">
<div class="stat-item">
<div class="stat-value">{{ drawnItems.length }}</div>
<div class="stat-label">要素总数</div>
</div>
<div class="stat-item">
<div class="stat-value">{{ markersCount }}</div>
<div class="stat-label">点标记</div>
</div>
<div class="stat-item">
<div class="stat-value">{{ polygonsCount }}</div>
<div class="stat-label">多边形</div>
</div>
</div>
</div>
</div>
</div>
<script>
const { createApp, ref, reactive, onMounted, computed } = Vue;
createApp({
setup() {
// 地图实例
let map = null;
let drawControl = null;
// 当前坐标信息
const currentLat = ref(0);
const currentLng = ref(0);
const currentZoom = ref(0);
// 已绘制的要素
const drawnItems = ref([]);
// 计算不同类型要素的数量
const markersCount = computed(() => {
return drawnItems.value.filter((item) => item.type === "marker")
.length;
});
const polygonsCount = computed(() => {
return drawnItems.value.filter(
(item) =>
item.type === "polygon" ||
item.type === "rectangle" ||
item.type === "circle"
).length;
});
// 初始化地图
const initMap = () => {
// 创建地图实例
map = L.map("map", {
center: [39.9042, 116.4074], // 北京
zoom: 12,
});
// 添加底图图层
L.tileLayer(
"https://webrd01.is.autonavi.com/appmaptile?lang=zh_cn&size=1&scale=1&style=8&x={x}&y={y}&z={z}"
).addTo(map);
// 初始化要素图层
const drawnItemsLayer = new L.FeatureGroup();
map.addLayer(drawnItemsLayer);
// 初始化绘制控件
drawControl = new L.Control.Draw({
position: "topright",
draw: {
polygon: {
shapeOptions: {
color: "#33a02c",
},
},
polyline: {
shapeOptions: {
color: "#3388ff",
},
},
rectangle: {
shapeOptions: {
color: "#e31a1c",
},
},
circle: {
shapeOptions: {
color: "#6a3d9a",
},
},
marker: {
icon: L.icon({
iconUrl:
"https://unpkg.com/leaflet@1.9.4/dist/images/marker-icon.png",
shadowUrl:
"https://unpkg.com/leaflet@1.9.4/dist/images/marker-shadow.png",
iconSize: [25, 41],
iconAnchor: [12, 41],
popupAnchor: [1, -34],
shadowSize: [41, 41],
}),
},
},
edit: {
featureGroup: drawnItemsLayer,
},
});
map.addControl(drawControl);
// 监听绘制事件
map.on(L.Draw.Event.CREATED, (event) => {
const layer = event.layer;
const featureType = event.layerType;
// 为要素添加自定义属性
layer.featureType = featureType;
layer.id = `feature_${Date.now()}`;
// 添加到图层
drawnItemsLayer.addLayer(layer);
// 添加到状态管理
drawnItems.value.push({
id: layer.id,
type: featureType,
layer: layer,
});
});
// 监听编辑事件
map.on(L.Draw.Event.EDITED, () => {
// 更新要素列表
drawnItems.value = [...drawnItems.value];
});
// 监听删除事件
map.on(L.Draw.Event.DELETED, (event) => {
const deletedIds = event.layers
.getLayers()
.map((layer) => layer.id);
drawnItems.value = drawnItems.value.filter(
(item) => !deletedIds.includes(item.id)
);
});
// 监听地图移动事件
map.on("mousemove", (event) => {
currentLat.value = event.latlng.lat.toFixed(6);
currentLng.value = event.latlng.lng.toFixed(6);
});
// 监听缩放事件
map.on("zoomend", () => {
currentZoom.value = map.getZoom();
});
// 初始值
const center = map.getCenter();
currentLat.value = center.lat.toFixed(6);
currentLng.value = center.lng.toFixed(6);
currentZoom.value = map.getZoom();
};
// 激活绘制工具
const activateDrawTool = (toolType) => {
if (drawControl) {
drawControl.setDrawingOptions({
[toolType]: true,
});
drawControl._toolbars.draw._modes[toolType].handler.enable();
}
};
// 取消绘制
const deactivateDrawTool = () => {
if (drawControl) {
drawControl._toolbars.draw._modes[
drawControl._toolbars.draw._activeMode
].handler.disable();
}
};
// 获取要素类型名称
const getFeatureType = (feature) => {
const typeMap = {
marker: "点标记",
polyline: "线条",
polygon: "多边形",
rectangle: "矩形",
circle: "圆形",
};
return typeMap[feature.type] || feature.type;
};
// 缩放到要素
const zoomToFeature = (feature) => {
if (feature.layer) {
map.fitBounds(feature.layer.getBounds());
}
};
// 移除要素
const removeFeature = (feature) => {
if (feature.layer) {
map.removeLayer(feature.layer);
drawnItems.value = drawnItems.value.filter(
(item) => item.id !== feature.id
);
}
};
// 组件挂载后初始化地图
onMounted(() => {
initMap();
});
return {
currentLat,
currentLng,
currentZoom,
drawnItems,
markersCount,
polygonsCount,
activateDrawTool,
deactivateDrawTool,
getFeatureType,
zoomToFeature,
removeFeature,
};
},
}).mount("#app");
</script>
</body>
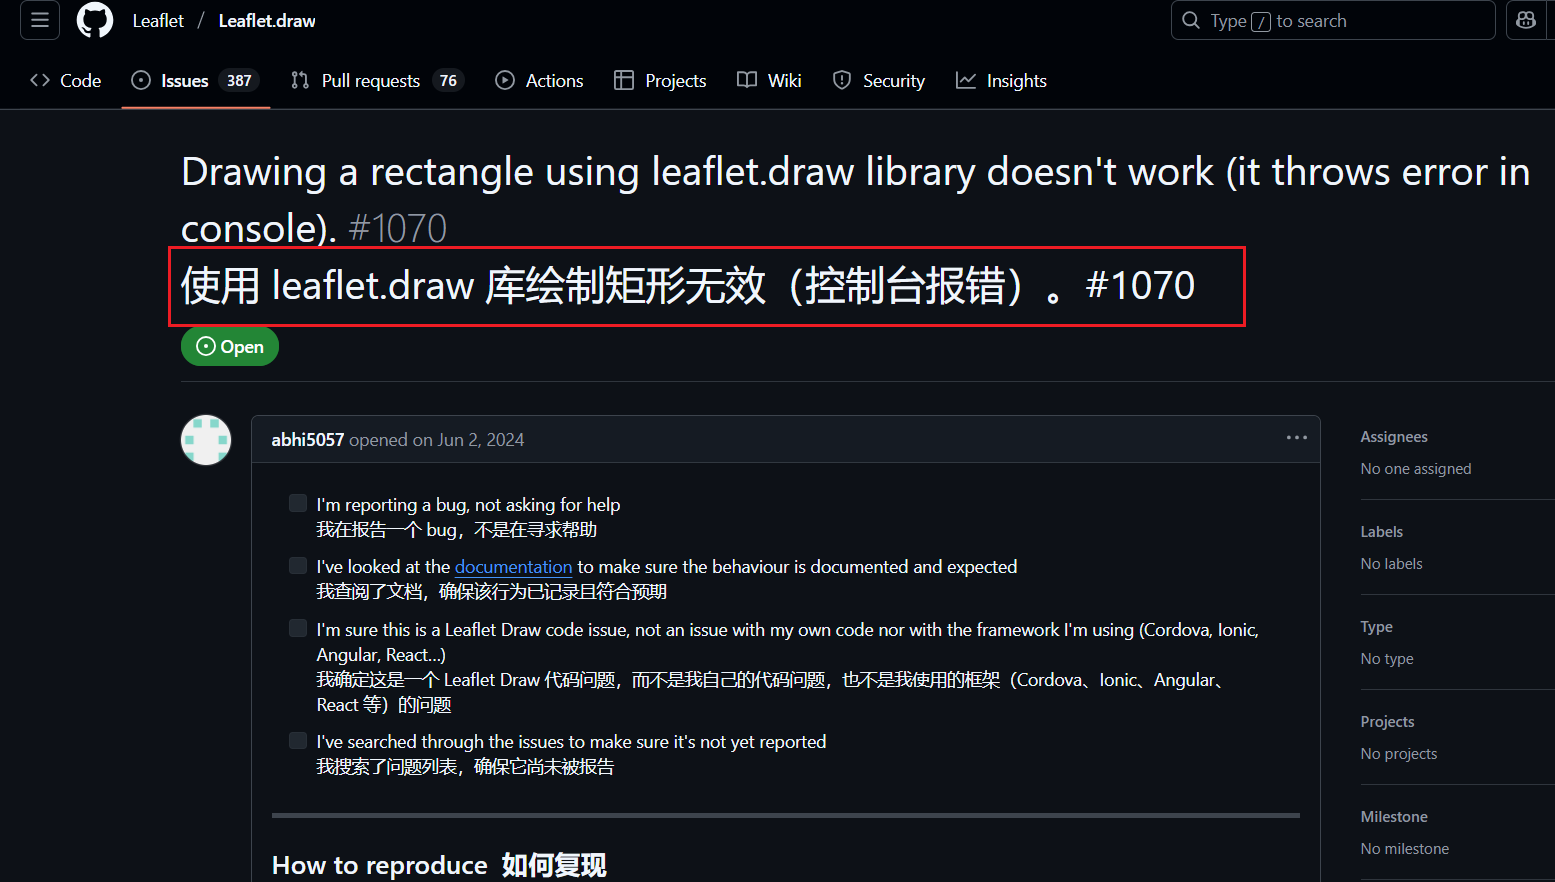
</html>issues
issurs 中也有人遇到了该问题,理性使用第三方插件
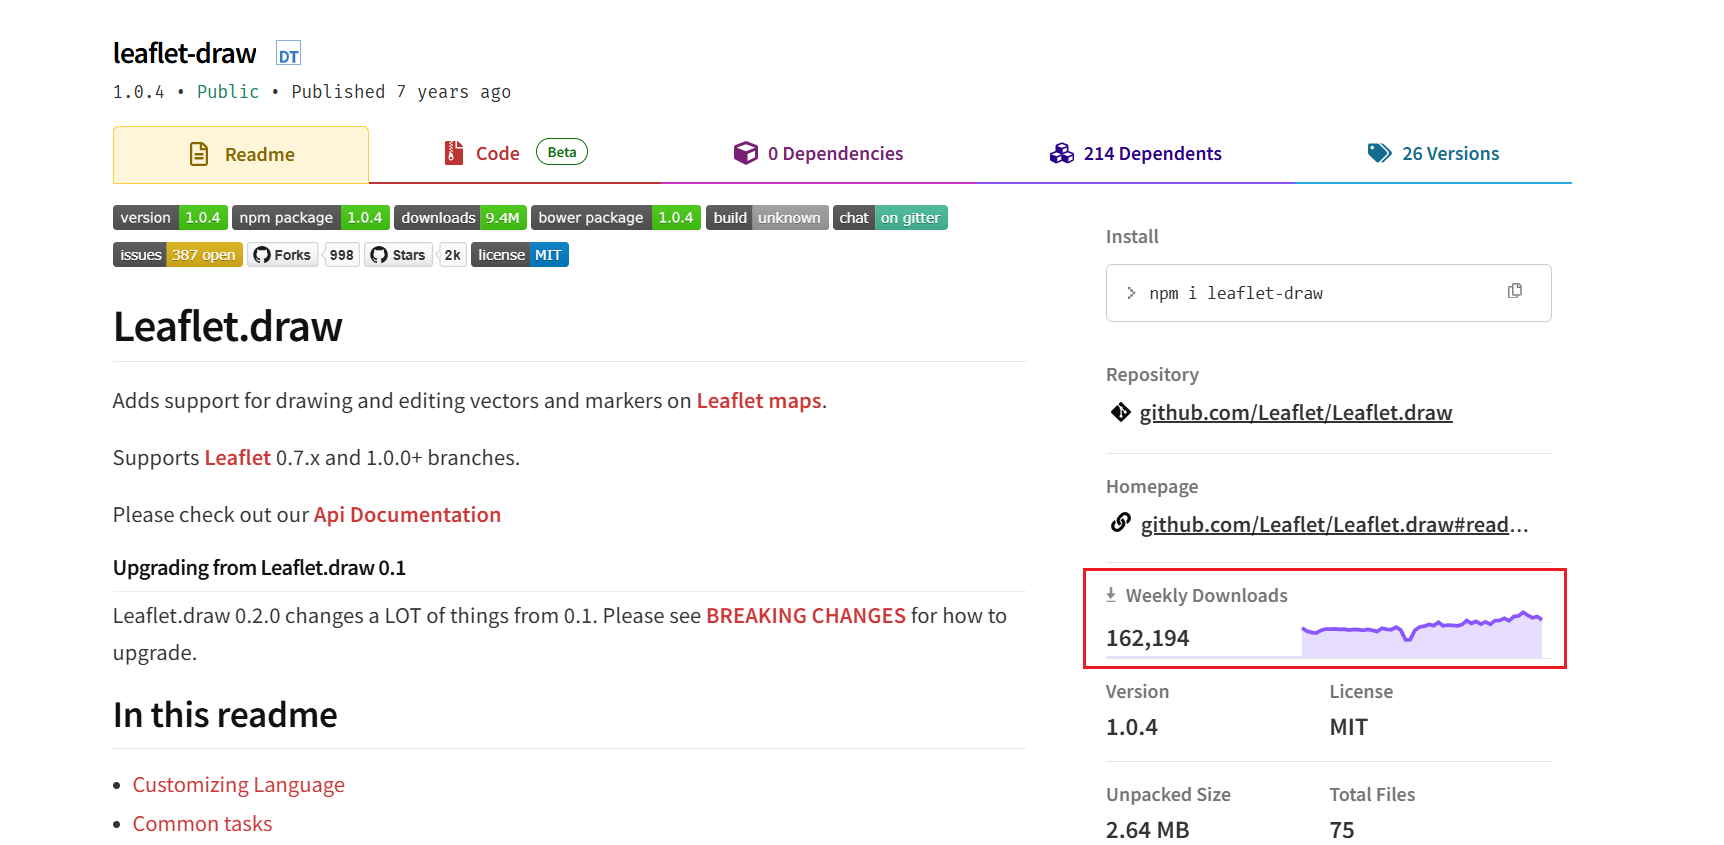
看了下 npm 周下载量挺高,难道有别的方式解决绘制问题吗?可以一起讨论一下