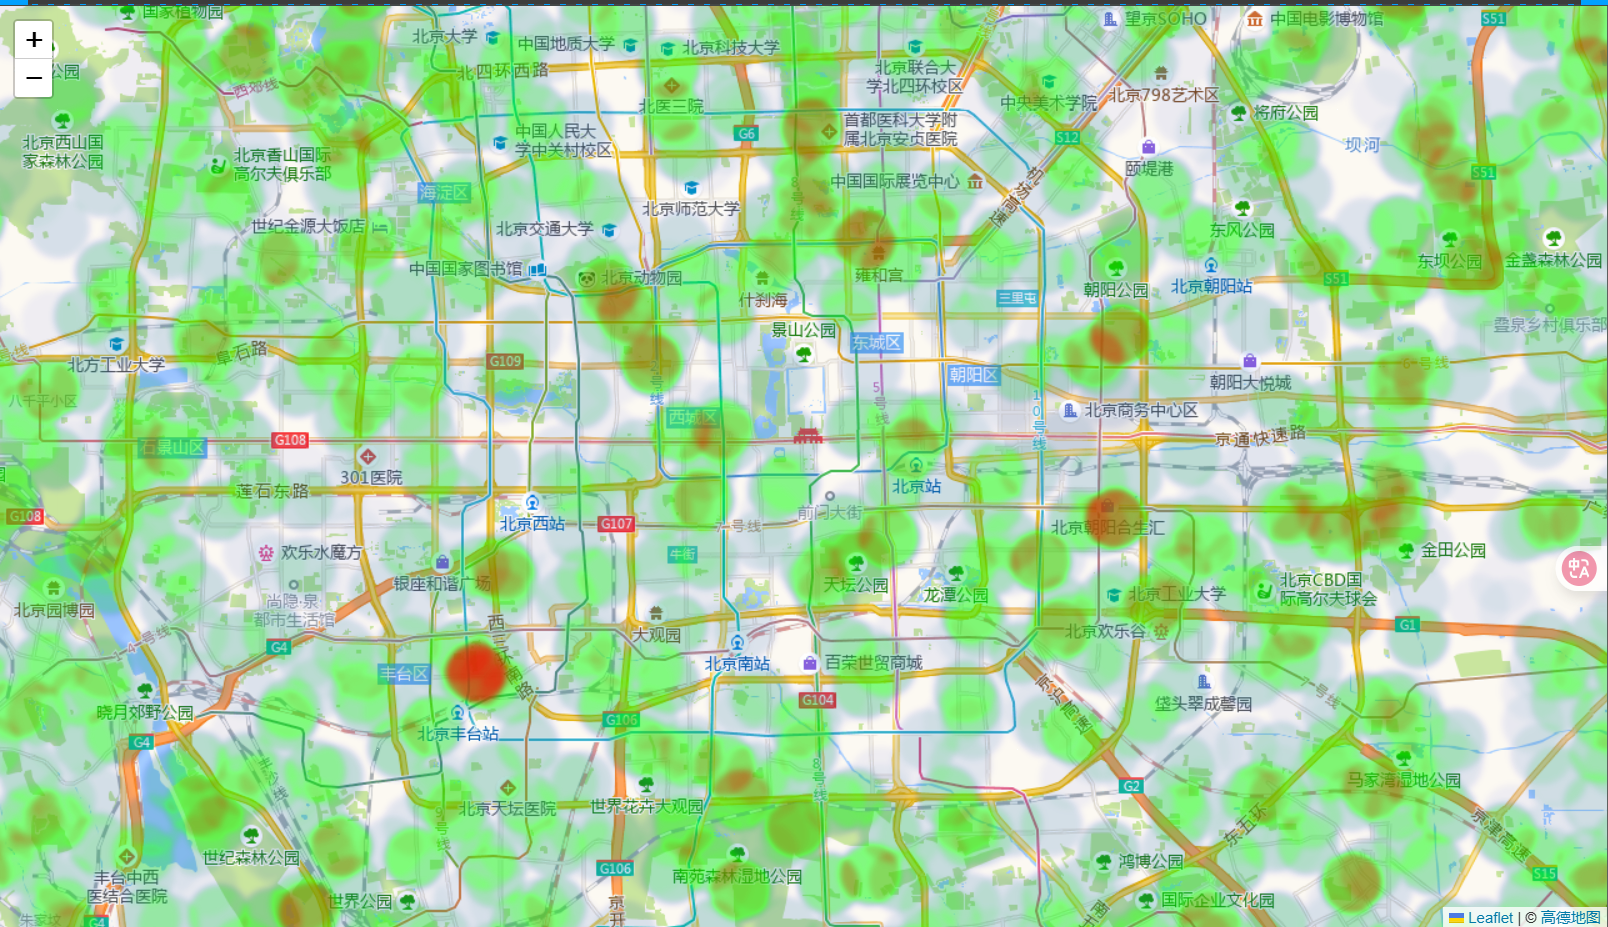
案例 热力图
功能说明
使用 Leaflet 插件 Leaflet.heat 实现聚类图层
bash
npm install leaflet.heat展开代码
vue
<template>
<div class="map-wrapper">
<div id="map-heatmap" class="map-container"></div>
</div>
</template>
<script setup>
import { ref, onMounted, onUnmounted } from "vue";
import "leaflet/dist/leaflet.css";
import L from "leaflet";
import "leaflet.heat"; // 引入热力图插件JS
let map = null;
let heatLayer = null;
const showHeatmap = ref(true);
const initialView = [39.909186, 116.397479];
const initialZoom = 12;
onMounted(() => {
map = L.map("map-heatmap").setView(initialView, initialZoom);
L.tileLayer(
"https://webrd01.is.autonavi.com/appmaptile?lang=zh_cn&size=1&scale=1&style=8&x={x}&y={y}&z={z}",
{
maxZoom: 18,
minZoom: 3,
attribution: '© <a href="https://www.amap.com/">高德地图</a>',
}
).addTo(map);
// 生成一些随机热力点数据
// 数据格式为 [纬度, 经度, 强度]
const heatData = [];
for (let i = 0; i < 500; i++) {
const lat = 39.909186 + (Math.random() - 0.5) * 0.5; // 在中心点附近随机生成
const lng = 116.397479 + (Math.random() - 0.5) * 0.5;
const intensity = Math.random() * 10; // 强度在0-10之间
heatData.push([lat, lng, intensity]);
}
// 创建热力图层
heatLayer = L.heatLayer(heatData, {
radius: 25, // 热力点半径
blur: 5, // 模糊度
maxZoom: 17, // 在此缩放级别以上不再模糊
gradient: {
// 颜色渐变
0.0: "blue",
0.5: "lime",
1.0: "red",
},
}).addTo(map);
});
onUnmounted(() => {
if (map) {
if (heatLayer) {
map.removeLayer(heatLayer);
}
map.remove();
map = null;
heatLayer = null;
}
});
</script>
<style scoped>
.map-wrapper {
display: flex;
flex-direction: column;
height: 100vh;
width: 100vw;
font-family: sans-serif;
box-sizing: border-box;
}
@media (min-width: 768px) {
.map-wrapper {
flex-direction: row;
}
}
.map-container {
flex-grow: 1;
height: 100%;
min-height: 300px;
background-color: #e0e0e0;
}
</style>